Data Visualization With Plotly Express
A live book to read and run
This book introduces readers to Plotly Express, a simple yet powerful Python library for data visualization. It is best read and run. Each chapter is available as a Jupyter Notebook file and can be opened in Google Colab with a mouse click or can be downloaded and uploaded to any Jupyter Notebook environment.
About the Author
Dr. Chaojie Wang is a seasoned software engineer, data scientist, and multidisciplinary researcher. He works at the MITRE Corporation as Principal Systems Engineer providing technology and management consulting to the US federal government. He is an adjunct professor at UMBC and Harrisburg University. This book is the result of his years of teaching statistical analysis and data visualization graduate course. He holds a Doctor of Science in Information Systems and Communications degree from Robert Morris Univeristy. Dr. Wang is a lifelong learner and enjoys reading, writing, thinking, and running.
Email: wcj365@gmail.com
Home Page: wcj365.gitee.io
LinkedIn Profile: linkedin.com/in/wcj365
About the Logo
The logo of this book is the ancient form of the modern Chinese character Bird(鸟). Chinese characters can be thoguht of as very early visualizations. They were created thousands of years ago and were written on turtle backbones also known as oracles.
Figure 1 shows how the ancient character Bird takes the visual form of a real bird.
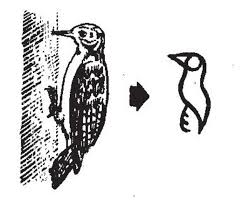
Figure 2 shows the modern form of the character Bird. Even though the modern form has changed quite a bit but it retains the image of a real bird.